Demand Side Analytics (DSA) recently conducted two similar studies on the accuracy of using smart meter data for evaluation and settlement of energy efficiency, also known as meter-based methods. Different jurisdictions refer to these meter-based methods with distinctive terminology. Across our two studies, California (for Pacific Gas & Electric) refers to these methods as normalized metered energy consumption (NMEC) while Vermont (for the Vermont Department of Public Service) refers to them as Advanced Measurement & Verification (M&V).
What are Meter-Based Methods?
The primary challenge of estimating energy savings is the need to accurately detect changes in energy consumption due to the energy efficiency intervention, while systematically eliminating plausible alternative explanations for those changes. Did the introduction of energy efficiency measures cause a change in energy use? Or can the differences be explained by other factors (such as the effects of the COVID-19 pandemic)? To evaluate energy savings, it is necessary to estimate what energy consumption would have been in the absence of program intervention—the counterfactual or baseline.
Meter-based methods rely on whole-building, site-specific electric and/or gas consumption data, either at the hourly or daily level, to construct the baseline. This data is then used to estimate energy savings associated with the installation of individual or multiple energy efficiency measures (EEMs) at the site.
Why rely on Meter-Based Methods?
Many methods exist to estimate savings associated with EEMs, all with varying degrees of modeling complexity, data requirements, accuracy, and precision. The benefits of using meter-based methods include:
- Eliminating the need for sampling because data is available for nearly all participants.
- Reducing the burden on participants because technicians don’t need to visit the home or business to install metering equipment.
- Producing faster feedback on energy-saving performance.
- Enabling program administrators to look beyond the average customer and explore how savings vary across segments of interest.
- Opening new opportunities for program design and delivery (i.e., pay-for-performance programs).
- Producing granular savings estimates that are useful for a wide range of planning and valuation functions.
California
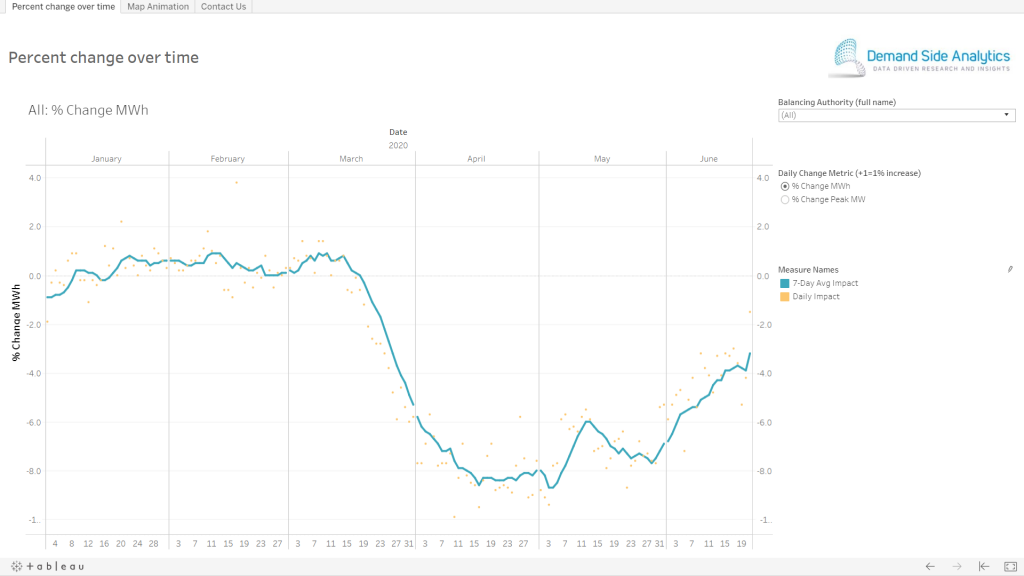
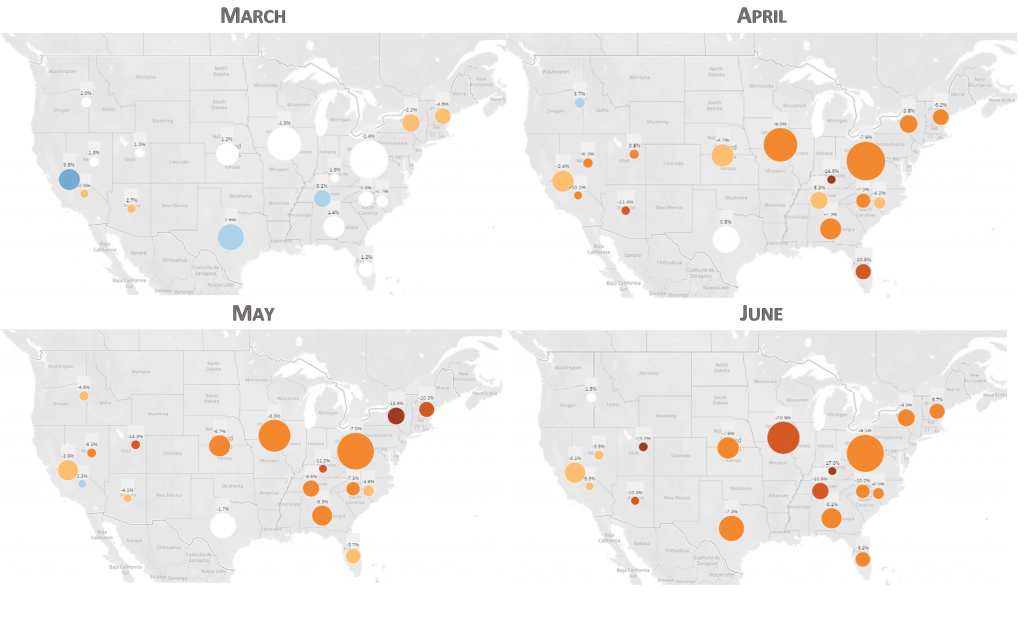
Pacific Gas and Electric Company (PG&E) currently uses the CalTRACK Version 2.0 method (CalTRACK) to estimate avoided energy use for its energy efficiency programs based on the Population-Level NMEC methodology. A notable feature of the population NMEC method has been the lack of comparison groups, which are used to adjust the energy savings baseline and normalize the savings estimate for factors beyond weather. The pre-post method without a comparison group relies almost exclusively on weather normalization and effectively assumes that the only difference between the pre- and post-intervention periods is weather and the installation of EEMs. The COVID-19 pandemic laid bare the limitations of the adopted method. The pandemic led to changes in our commutes, business operations, and home use patterns. Not surprisingly, it has also changed how, when, and how much electricity and gas we use. Moreover, the impact on energy use differs for residential customers and various types of businesses.
Given the changes in energy consumption that have occurred over the course of the COVID-19 pandemic, the need for alternative approaches to CalTRACK and similar, simple pre-post regression methods for estimating EE impacts is paramount. While adding comparison groups typically improves the accuracy of these energy saving estimates, there are three main logistical challenges:
- Privacy of non-participant customer data. Current California laws and regulation exist to protect the privacy of advanced metering infrastructure (AMI) or smart meter data for individual customers.
- Transparency Challenges. Many evaluation methods that rely on a comparison group require extensive calculation in order to construct the group. This complexity can hinder independent review and/or replication of the findings.
- Complexity and frequency. PG&E and third-party EE program implementers target a wide range of customer segments and geographic areas, each of which require regular and specifically targeted non-participant data for evaluation. This consideration adds complexity to existing program administration processes.
To determine if there are viable alternative models that can accommodate the effects of the COVID-19 pandemic or other wide-scale non-routine events, DSA conducted an accuracy assessment of the existing Population NMEC methods as well as a variety of other methods with and without comparison groups.
What did we do?
Accurate and unbiased estimates of energy efficiency impacts are critical for utility program staff, third-party program implementers, and regulators. In evaluating the accuracy of the existing Population NMEC methods used in the PG&E territory, we tested a variety of other methods, with and without comparison groups, to simulate a competition and identify the methods that are unbiased and accurate (Figure 1).
The accuracy of these methods are assessed by applying placebo treatment on customers that did not participate in EE programs during the period analyzed. The impact of a program (or in this case, a pseudo-program) is calculated by estimating a counterfactual and comparing it to the observed consumption during the post-treatment period. Because no EEMs were installed in this simulation, any deviation between the counterfactual and actual loads is due to error. The process is repeated hundreds of times – a procedure known as bootstrapping – to construct the distribution of errors.
Figure 1: General Approach for Accuracy Assessment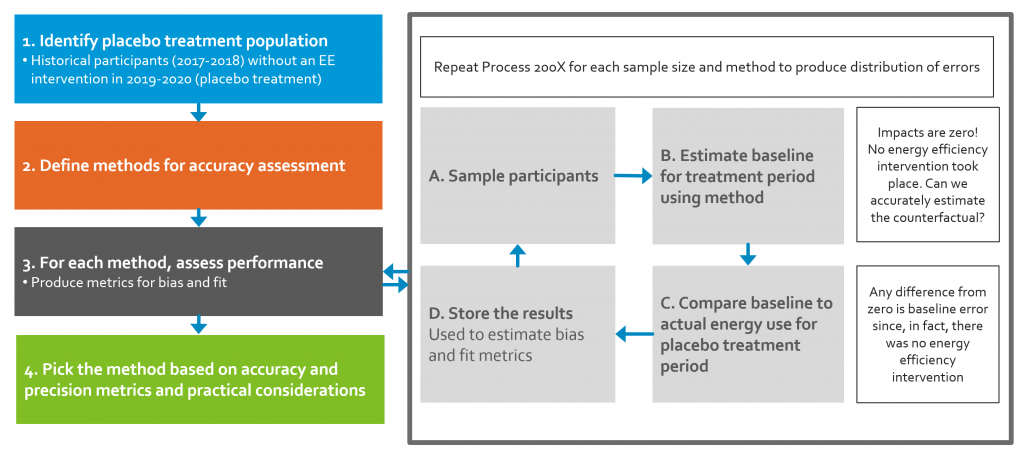
What did we find?
- Population NMEC methods without comparison groups cannot account for the effects of the COVID-19 pandemic.
- The existing population NMEC methods without comparison groups show upward bias even prior to the effects of the pandemic.
- Comparison groups improve accuracy of the CalTRACK method.
- When constructing a matched control group, the choice of segmentation and matching characteristics matter more than the method of matching customers.
- Synthetic controls may perform well but are highly sensitive to the choice of segmentation used.
- Using aggregated granular profiles instead of individual matched controls in Difference-in-Differences methods yields comparable results to using individual customer matched controls.
- Accuracy and precision are dependent upon the number of sites aggregated together (Figure 2).
- No method is completely free of error.
Figure 2: Distribution of Error across Comparison Groups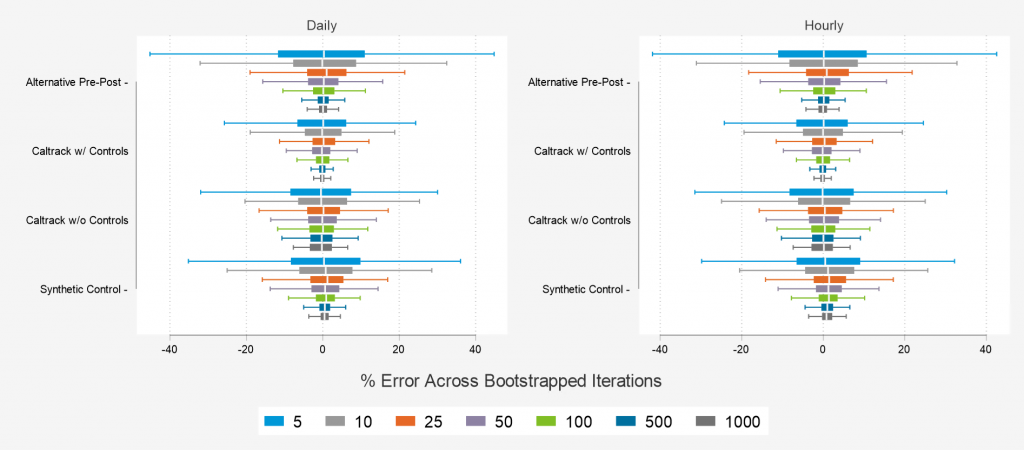
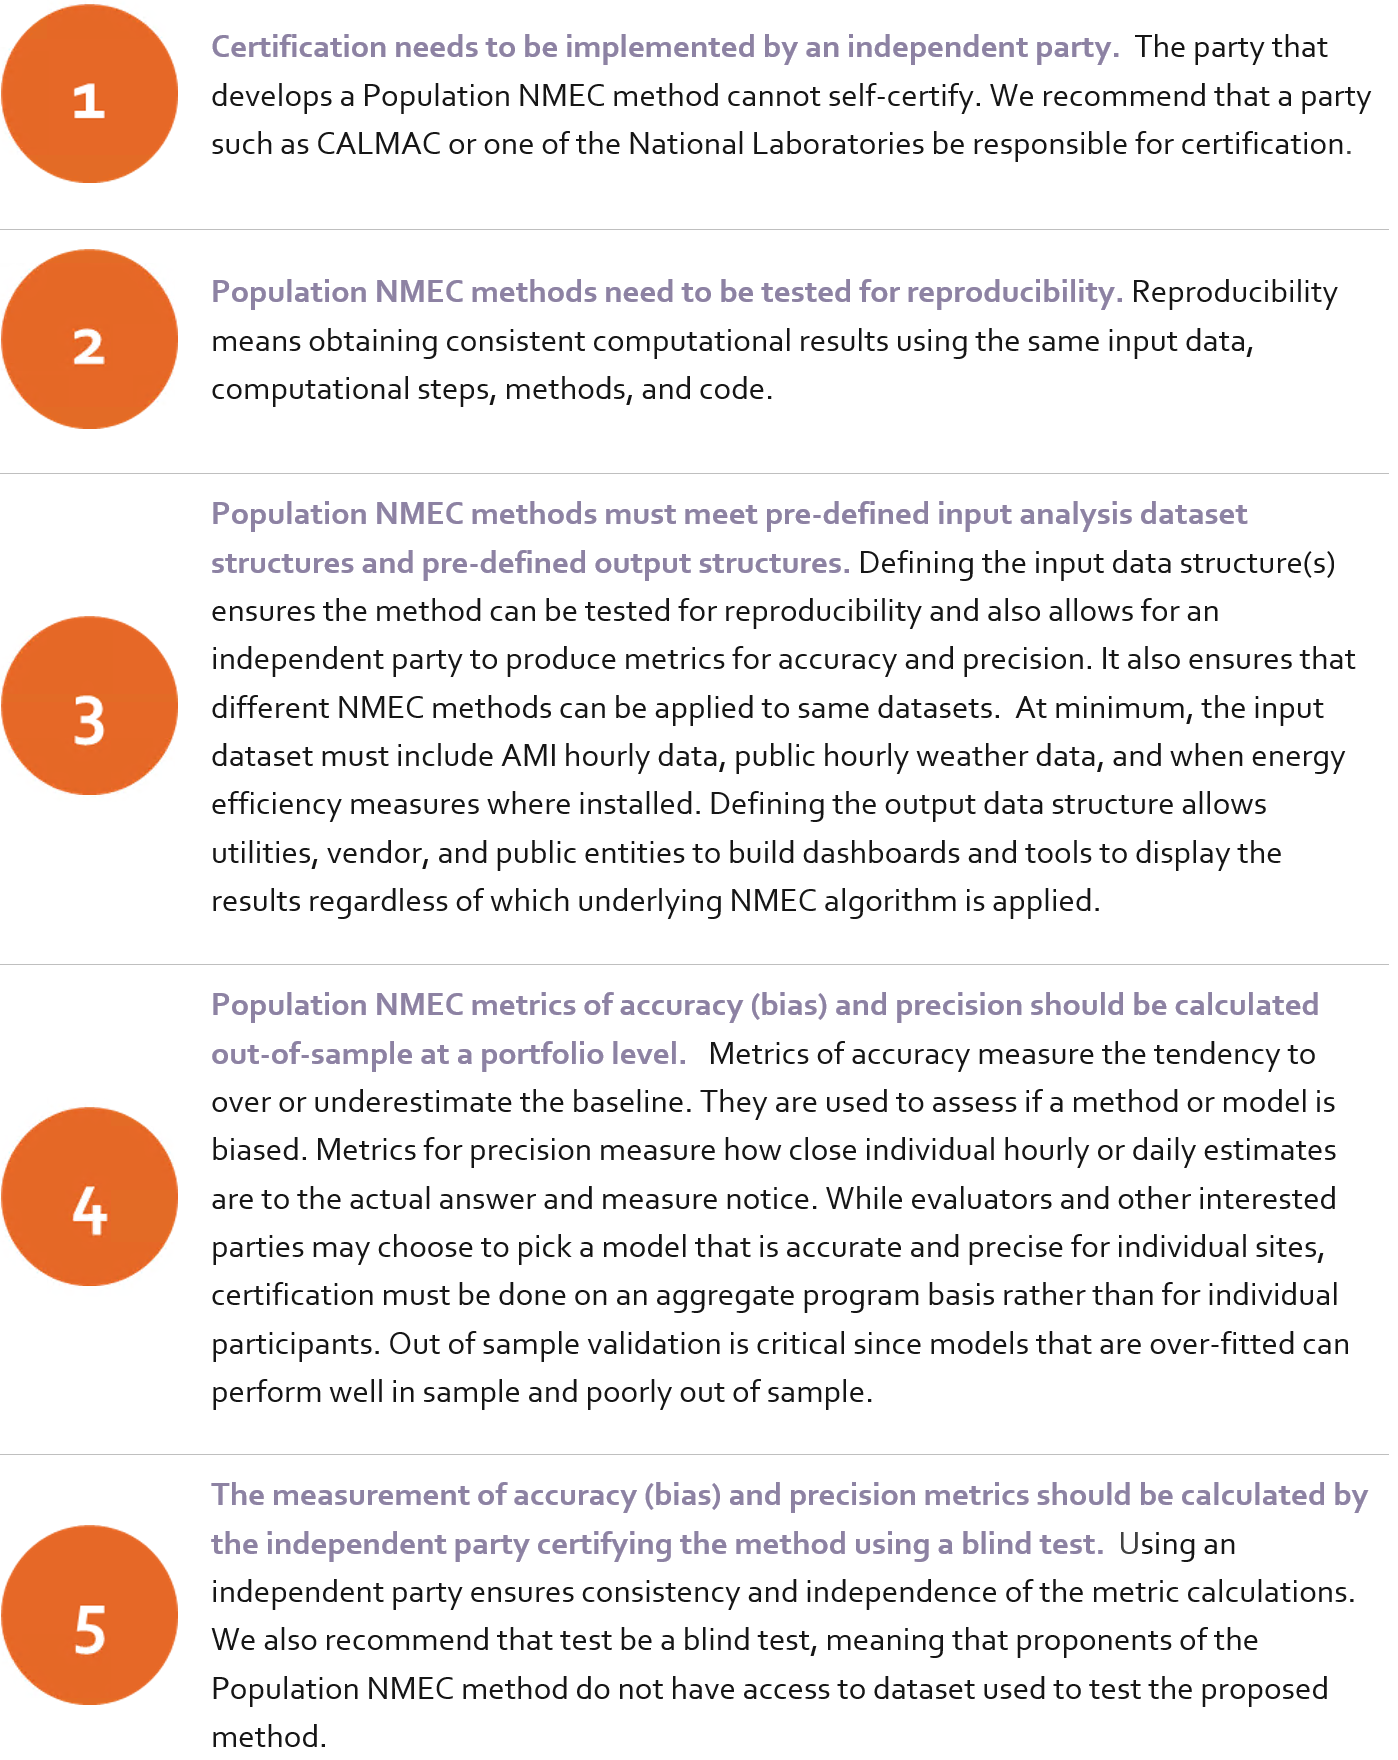
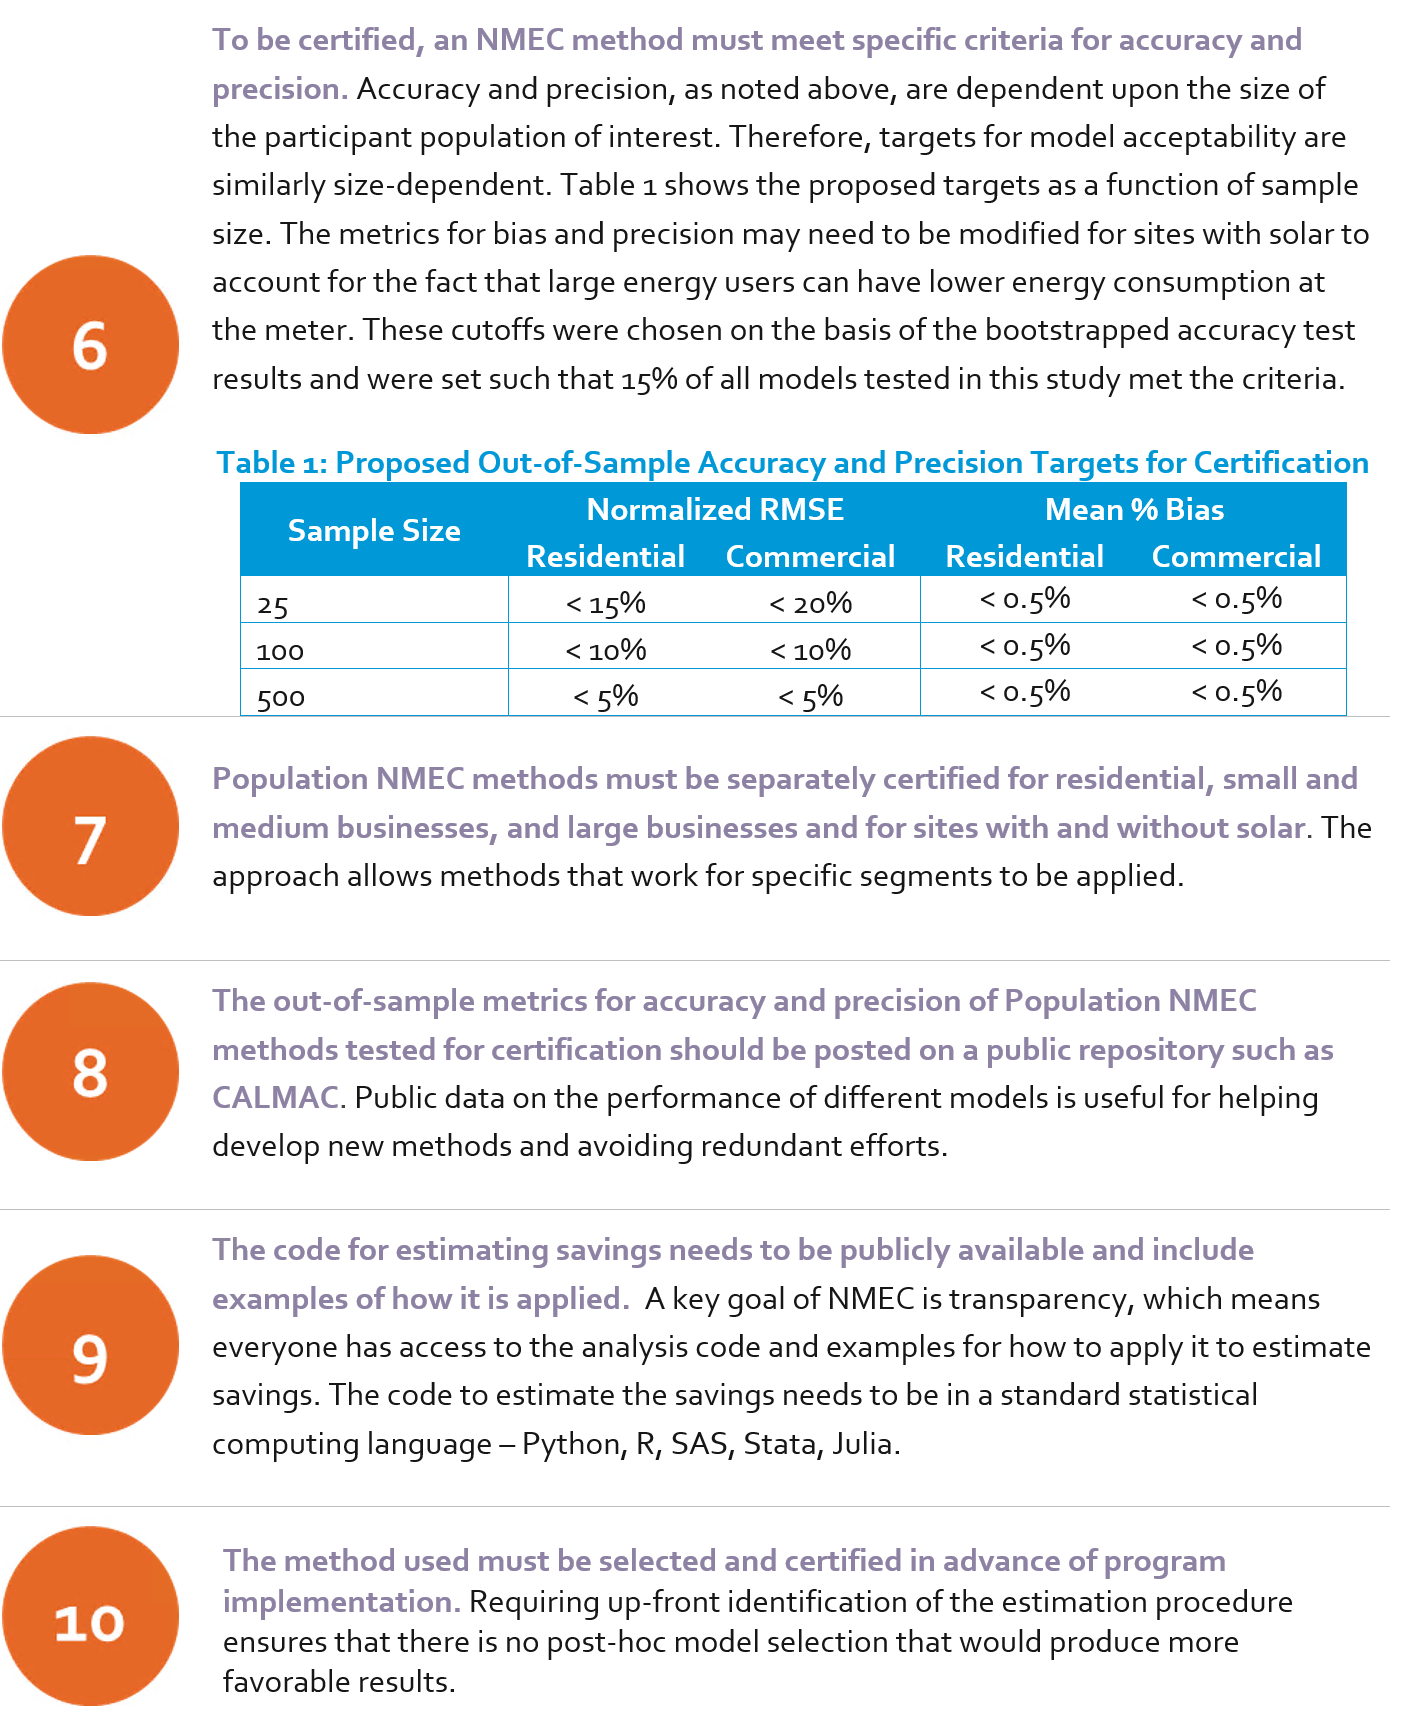
Given these findings, rather than try to produce a single prescriptive method for NMEC analyses of energy efficiency programs, we instead recommend a framework by which proposed NMEC methods can be tested, certified, and used to estimate savings:
Vermont
The primary objective of the Hourly Impact of Energy Efficiency Evaluation Pilot was to better understand the time-value of energy efficiency measure savings and the implications for program design, delivery, and evaluation. Because energy efficiency in the Northeast qualifies for capacity value, accurate estimates of the contribution of energy efficiency to peak hours is critical. Using high-frequency 15-minute consumption data from Green Mountain Power’s AMI and program tracking data from Efficiency Vermont, the study team modeled energy consumption of participating homes and businesses separately in the pre-installation and the post-installation periods. These two periods were compared to understand how consumption changed following installation of an energy efficiency or beneficial electrification measure. A secondary objective of the study was to compare Advanced M&V methods, or regression-based modeling of utility meter data, with the approaches traditionally used in Vermont. This comparison helped to determine where Advanced M&V could offer cost savings, improve the accuracy and granularity of savings estimates, and identify lessons for program operations.
What did we do?
To generate savings for the 21 prescriptive measures and the 124 custom projects in Vermont, we implemented Advanced M&V procedures that build upon the International Performance Measurement and Verification Protocol (IPMVP) Option C Whole Facility approach to energy savings estimation. We do this through a regression model that follows Lawrence Berkeley National Laboratory’s (LBNL) Time-of-Week Temperature (TOWT) Model, where the dependent variable is hourly electric consumption from the meter and the independent variables contain information about the weather, day of week, and time of day.
This methodology estimates efficiency impacts in each hour of the year. Granular results provide insight into the distribution of energy savings across a year. For example, Figure 3 shows a heat map of the average energy savings from installing a variable speed heat pump. This measure’s model estimates a large load increase during the winter months (blue regions). Negative savings are a good thing in this case because it means Vermont homes are using the heat pump for heating and displacing delivered fuel consumption. There is also a pocket of denser load increase in the summer months during the middle of the day, presumably due to homes that may not have had air conditioning previously using the heat pump as an air conditioner.
Figure 3: Variable Speed Heat Pump Heat Map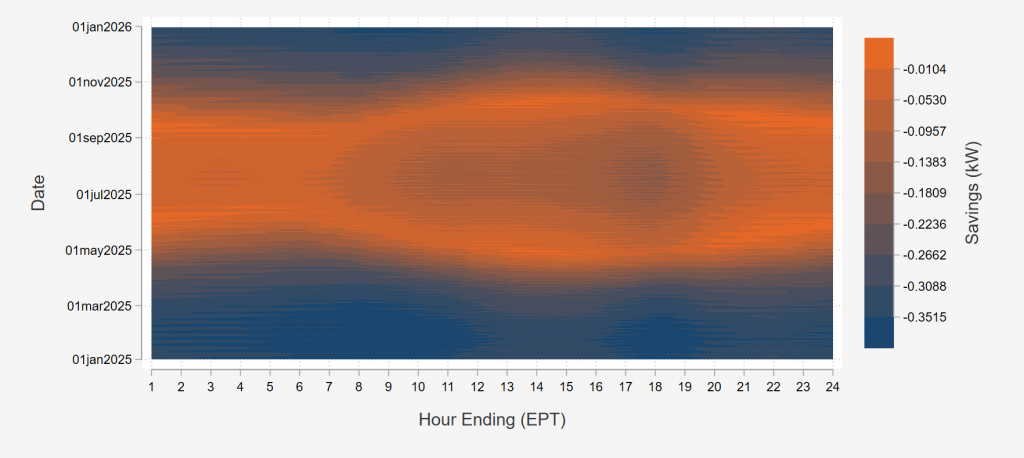
What did we find?
- Modelling success for prescriptive measures is a function of effect size and number of participants.
- There are challenges when using Advanced M&V for “market opportunity” measures, where the baseline is a hypothetical new piece of equipment with code-minimum efficiency. This assumption creates issues because the pre-installation meter data reflects the replaced equipment at the end of its useful life.
- For custom projects, Advanced M&V methods work best for sites with predictable load patterns and large savings as a percent of total consumption (Figure 4).
- With the level of noise present, we caution against using site-specific results to determine incentive levels in Vermont and suggest Advanced M&V is more useful as a program evaluation tool.
- Advanced M&V is a powerful tool, but it is not the right tool for every job.
Figure 4: Example of a Well-Behaved Custom Project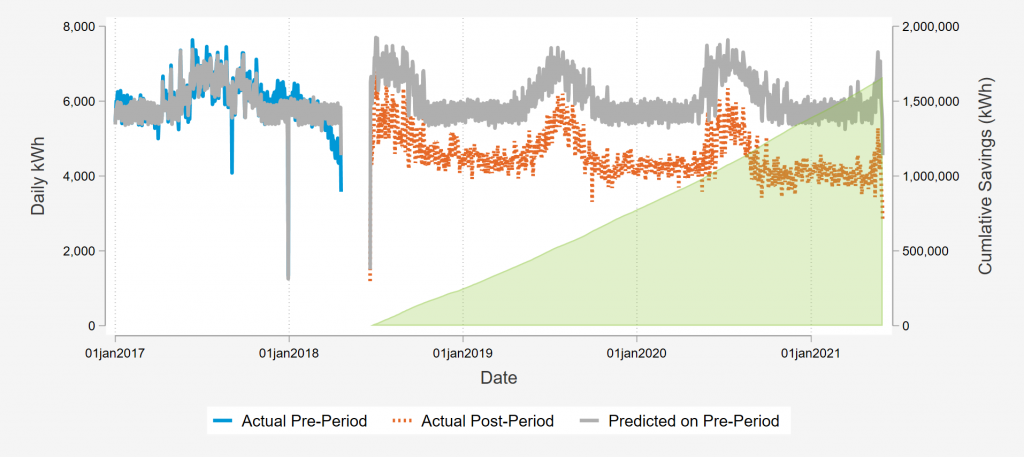
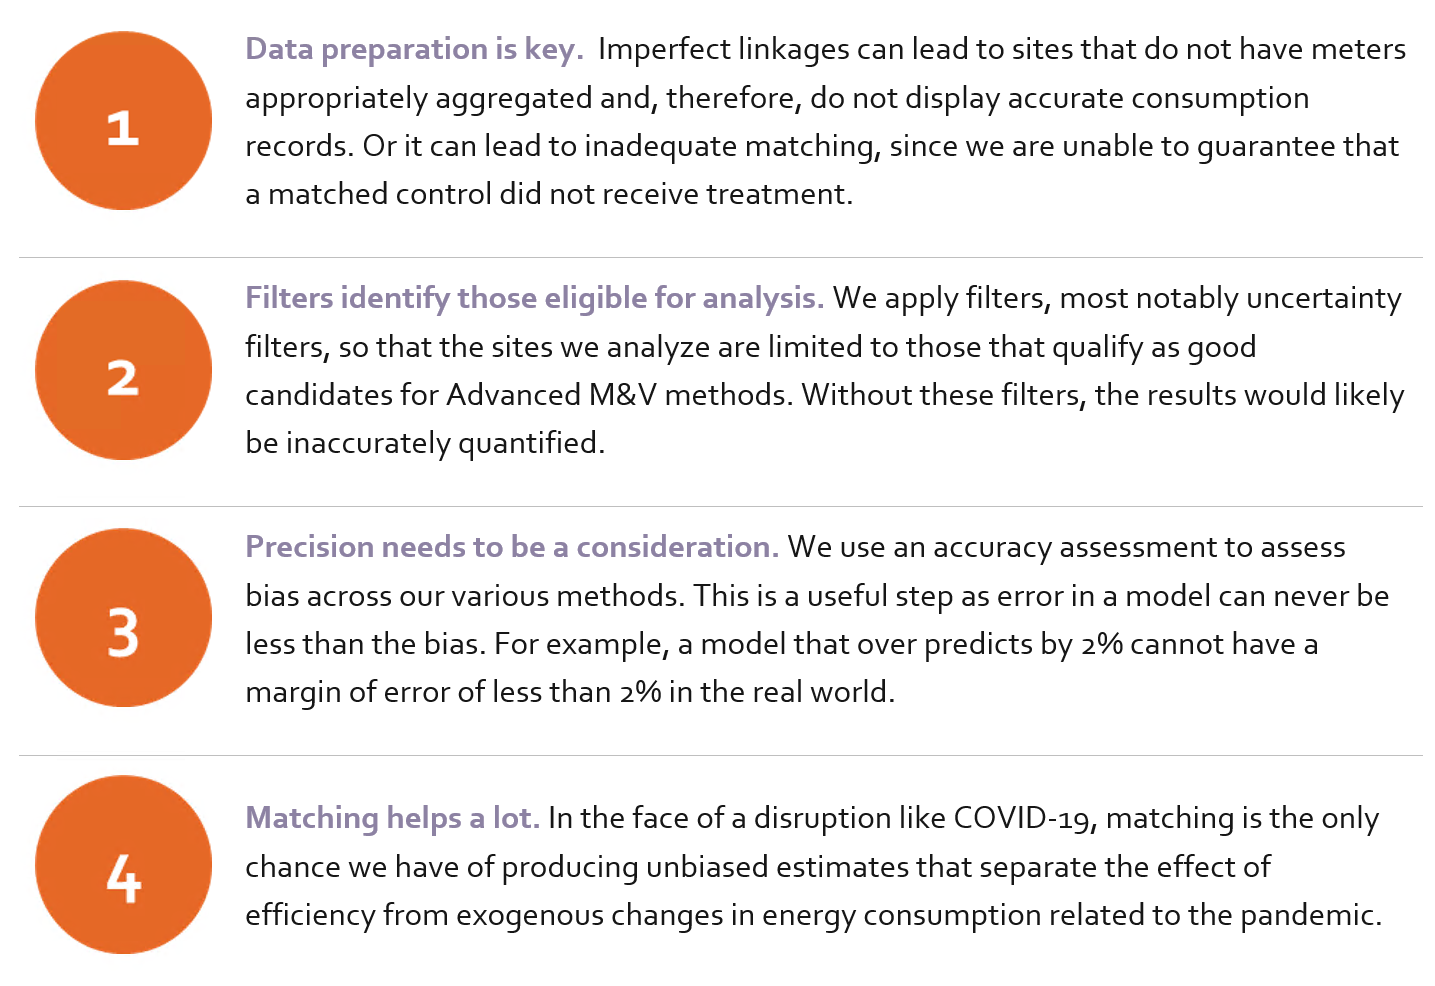
Given these findings, to have a chance at accurately and precisely estimating savings from efficiency measures, the guidance below must be taken into consideration: